Samsara uses several third-party components, such as Apache ZooKeeper, Apache Kafka, ElasticSearch, Kibana etc. Samsara provides production quality Docker images for those components to help you get started quickly.
How to start a local environment
- Local docker engine (Linux, Mac OS X, Windows)
- Using docker machine (Windows, OSX & Linux)
- Mac OS X with boot2docker
- Want to use the latest development version?
Local docker engine (Linux, Mac OS X, Windows)
A local environment is ideal for development and testing purposes. It sets up a fully running cluster with all components but without fault tolerance.
Please make sure you have the latest docker
and docker-compose
installed.
If you are on OSX we strongly recommend to use Docker for Mac.
Once docker and docker-compose are installed, run the following to pull the required samsara docker images
IMPORTANT: Make sure that the docker engine has at least 4GB of memory in order to proceed.
git clone https://github.com/samsara/samsara.git

cd samsara/docker-images
docker-compose pull
Now to start the services:
docker-compose up
when the service is ready you will see the following message:
;;;;;;;;;;;;;;;;;;;;;;;;;;;;;;;;;;;;;;;;;;;;;;;;;;;;;;;;;;;;;;;;;;;;;;;;;;;;;;;;
;;                                                                            ;;
;;    ---==| S A M S A R A   I S   R E A D Y   F O R   A C T I O N |==----    ;;
;;                                                                            ;;
;;;;;;;;;;;;;;;;;;;;;;;;;;;;;;;;;;;;;;;;;;;;;;;;;;;;;;;;;;;;;;;;;;;;;;;;;;;;;;;;
Once the service is up and running you can then access the following main services:
| service | port |
|---|---|
| ingestion-api | http://127.0.0.1:9000 |
| kibana | http://127.0.0.1:8000 |
| graphana | http://127.0.0.1:15000 |
| elasticsearch | http://127.0.0.1:9200/_plugin/kopf/ |
| elasticsearch | http://127.0.0.1:9200/_plugin/head/ |
Data paths and logs are mounted on /tmp/data and /tmp/logs respectively.
Next try pushing a few events:
cat <<EOF | curl -i -H "Content-Type: application/json" \
                -H "X-Samsara-publishedTimestamp: $(date +%s999)" \
                -XPOST "http://localhost:9000/v1/events" -d @-
[
  {
    "timestamp": $(date +%s000),
    "sourceId": "3aw4sedrtcyvgbuhjkn",
    "eventName": "user.item.added",
    "page": "orders",
    "item": "sku-1234"
  }, {
    "timestamp": $(date +%s000),
    "sourceId": "3aw4sedrtcyvgbuhjkn",
    "eventName": "user.item.removed",
    "page": "orders",
    "item": "sku-5433",
    "action": "remove"
  }
]
EOF
A successful output will look like:
HTTP/1.1 202 Accepted
Content-Length: 0
Server: http-kit
Date: Mon, 11 Jan 2016 06:54:10 GMT
Next you can connect to kibana and see your events:
In your browser open http://localhost:8000/
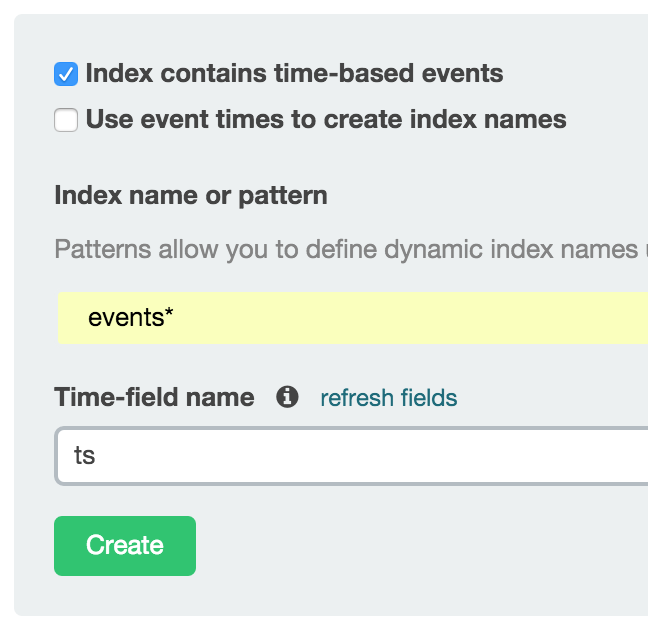
Here you will be presented with the Kibana’s setup page. Set the following options:
- Check
Index contains time-based events - Enter
events*in theIndex name or patternfield - From the drop-down
Time-field nameselectts - Press
Create
A new page will appear showing the current mapping of the index, next
you can click Discover to visualize your events. By clicking on the
clock on the top-right corner you will be able to change the time
range and activate an auto-refresh of 5-10 seconds.
Now you should be able to see your events and as you push new events you should be able to see the new ones too.
Finally, to stop all services.
docker-compose stop
What’s next?
If you would like to know more, we would suggest to read a bit more about the general Design principles and start developing your own stream processing pipeline as described in Getting started with development and Samsara Stream processing.
Troubleshooting
If something goes wrong and you want a clean start run:
# remove the existing containers
docker-compose stop
docker-compose rm -f
sudo rm -fr /tmp/logs /tmp/data

# start with a fresh bootstrap
docker-compose up
Using Docker Machine (Windows, OSX & Linux)
A local environment is ideal for development and testing purposes. It sets up a fully running cluster with all components but without fault tolerance.
Please make sure you have latest docker
and docker-machine
installed.
After you’ve installed docker and docker-machine on your OS, you should create a virtual box vm for Samsara
docker-machine create samsara-vm --driver virtualbox --virtualbox-memory 4096
IMPORTANT: Make sure that the docker engine has at least 4GB of memory in order to proceed.
Set up the docker client to use your samsara-vm vm by setting some docker environment variables.
Run the following command to show the environment variables and to set them
## Show the environment variables
docker-machine env samsara-vm
## Set the environment variables
eval "$(docker-machine env samsara-vm)"
Once the environment variables have been set, make a note of the vm’s IP by running the following command
docker-machine ip samsara-vm
NOTE: Your VM might have a different IP address, use whatever docker-machine ip told you to use. You probably want to add that environment variable to your shell config.
From now on we will assume that the docker host IP address is 192.168.99.100, if it is different in your environment please use your own IP instead.
Please make sure you have docker-compose
installed.
Once docker-compose is installed, run the following to pull the required samsara docker images
git clone https://github.com/samsara/samsara.git

cd samsara/docker-images
docker-compose pull
Now to start the services:
docker-compose up
when the service is ready you will see the following message:
;;;;;;;;;;;;;;;;;;;;;;;;;;;;;;;;;;;;;;;;;;;;;;;;;;;;;;;;;;;;;;;;;;;;;;;;;;;;;;;;
;;                                                                            ;;
;;    ---==| S A M S A R A   I S   R E A D Y   F O R   A C T I O N |==----    ;;
;;                                                                            ;;
;;;;;;;;;;;;;;;;;;;;;;;;;;;;;;;;;;;;;;;;;;;;;;;;;;;;;;;;;;;;;;;;;;;;;;;;;;;;;;;;
Once the service is up and running you can then access the following main services:
| service | port |
|---|---|
| ingestion-api | http://192.168.99.100:9000 |
| kibana | http://192.168.99.100:8000 |
| graphana | http://192.168.99.100:15000 |
| elasticsearch | http://192.168.99.100:9200/_plugin/kopf/ |
| elasticsearch | http://192.168.99.100:9200/_plugin/head/ |
Data paths and logs are mounted on /tmp/data and /tmp/logs respectively but they will reside in the samsara-vm vm.
Next try pushing a few events:
cat <<EOF | curl -i -H "Content-Type: application/json" \
                -H "X-Samsara-publishedTimestamp: $(date +%s999)" \
                -XPOST "http://192.168.99.100:9000/v1/events" -d @-
[
  {
    "timestamp": $(date +%s000),
    "sourceId": "3aw4sedrtcyvgbuhjkn",
    "eventName": "user.item.added",
    "page": "orders",
    "item": "sku-1234"
  }, {
    "timestamp": $(date +%s000),
    "sourceId": "3aw4sedrtcyvgbuhjkn",
    "eventName": "user.item.removed",
    "page": "orders",
    "item": "sku-5433",
    "action": "remove"
  }
]
EOF
A successful output will look like:
HTTP/1.1 202 Accepted
Content-Length: 0
Server: http-kit
Date: Mon, 11 Jan 2016 06:54:10 GMT
Next you can connect to kibana and see your events:
In your browser open http://192.168.99.100:8000/
Here you will be presented with the Kibana’s setup page. Set the following options:
- Check
Index contains time-based events - Enter
events*in theIndex name or patternfield - From the drop-down
Time-field nameselectts - Press
Create
A new page will appear showing the current mapping of the index, next
you can click Discover to visualize your events. By clicking on the
clock on the top-right corner you will be able to change the time
range and activate an auto-refresh of 5-10 seconds.
Now you should be able to see your events and as you push new events you should be able to see the new ones too.
Finally, to stop all services.
docker-compose stop
What’s next?
If you would like to know more, we would suggest to read a bit more about the general Design principles and start developing your own stream processing pipeline as described in Getting started with development and Samsara Stream processing.
Troubleshooting
If something goes wrong and you want a clean start run:
# remove the existing containers
docker-compose stop
docker-compose rm -f
docker-machine ssh samsara-vm 'sudo rm -fr /tmp/logs /tmp/data'

# start with a fresh bootstrap
docker-compose up
Mac OS X with boot2docker
A local environment is ideal for development and testing purposes. It setup a fully running cluster with all components but without fault tolerance.
On OS X you have to install something like boot2docker.io in order to use docker so please install.
# install boot2docker
brew update
brew install docker
brew install boot2docker

# initialize the vm
boot2docker init

# start the vm
boot2docker up

2014/08/21 13:51:29 Waiting for VM to be started...
.......
2014/08/21 13:51:50 Started.
2014/08/21 13:51:51   Trying to get IP one more time
2014/08/21 13:51:51 To connect the Docker client to the Docker daemon, please set:
2014/08/21 13:51:51     export DOCKER_HOST=tcp://192.168.59.103:2375


# Finally set the DOCKER_HOST environment variable export
DOCKER_HOST=tcp://192.168.59.103:2375
NOTE: Your VM might have a different IP address — use whatever boot2docker up told you to use. You probably want to add that environment variable to your shell config.
From now on we will assume that the docker host IP address is 192.168.59.103, if in your environment is different please use your own IP instead.
Please make sure you have docker-compose
installed.
Once docker-compose is installed, run the following to pull the required samsara docker images
git clone https://github.com/samsara/samsara.git

cd samsara/docker-images
docker-compose pull
Now to start the services:
docker-compose up
when the service is ready you will see the following message:
;;;;;;;;;;;;;;;;;;;;;;;;;;;;;;;;;;;;;;;;;;;;;;;;;;;;;;;;;;;;;;;;;;;;;;;;;;;;;;;;
;;                                                                            ;;
;;    ---==| S A M S A R A   I S   R E A D Y   F O R   A C T I O N |==----    ;;
;;                                                                            ;;
;;;;;;;;;;;;;;;;;;;;;;;;;;;;;;;;;;;;;;;;;;;;;;;;;;;;;;;;;;;;;;;;;;;;;;;;;;;;;;;;
Once the service is up and running you can then access the following main services:
| service | port |
|---|---|
| ingestion-api | http://192.168.59.103:9000 |
| kibana | http://192.168.59.103:8000 |
| graphana | http://192.168.59.103:15000 |
| elasticsearch | http://192.168.59.103:9200/_plugin/kopf/ |
| elasticsearch | http://192.168.59.103:9200/_plugin/head/ |
Data paths and logs are mounted on /tmp/data and /tmp/logs respectively but they will reside in the boot2docker vm.
Next try pushing a few events:
cat <<EOF | curl -i -H "Content-Type: application/json" \
                -H "X-Samsara-publishedTimestamp: $(date +%s999)" \
                -XPOST "http://192.168.59.103:9000/v1/events" -d @-
[
  {
    "timestamp": $(date +%s000),
    "sourceId": "3aw4sedrtcyvgbuhjkn",
    "eventName": "user.item.added",
    "page": "orders",
    "item": "sku-1234"
  }, {
    "timestamp": $(date +%s000),
    "sourceId": "3aw4sedrtcyvgbuhjkn",
    "eventName": "user.item.removed",
    "page": "orders",
    "item": "sku-5433",
    "action": "remove"
  }
]
EOF
A successful output will look like:
HTTP/1.1 202 Accepted
Content-Length: 0
Server: http-kit
Date: Mon, 11 Jan 2016 06:54:10 GMT
Next you can connect to kibana and see your events:
In your browser open http://192.168.59.103:8000/
Here you will be presented with the Kibana’ setup page. Set the following options:
- Check
Index contains time-based events - Enter
events*in theIndex name or patternfield - From the drop-down
Time-field nameselectts - Press
Create
A new page will appear showing the current mapping of the index, next
you can click Discover to visualize your events. By clicking on the
clock on the top-right corner you will be able to change the time
range and activate an auto-refresh of 5-10 seconds.
Now you should be able to see your events and as you push new events you should be able to see the new ones too.
Finally, to stop all services.
docker-compose stop
What’s next?
If you would like to know more, we would suggest to read a bit more about the general Design principles and start developing your own stream processing pipeline as described in Getting started with development and Samsara Stream processing.
Troubleshooting
If something goes wrong and you want a clean start run:
# remove the existing containers
docker-compose stop
docker-compose rm -f
boot2docker ssh sudo rm -fr /tmp/logs /tmp/data

# start with a fresh bootstrap
docker-compose up
Want to use the latest development version?
If you wish to try the latest unreleased version you just update the images in your
docker-compose file to use the latest snapshot version.
cd docker-images
docker-compose -f samsara-snapshot.yml pull
docker-compose -f samsara-snapshot.yml up
NOTE: This is really intended for development so time to time it might be broken.